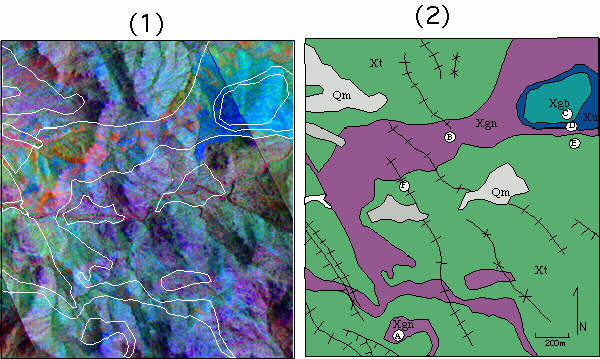
 (1) A TIMS image (5-3-1 decorrelation
stretch) and (2) corresponding geologic map showing several
important map units. To the Left are TIMS (red squares) and
lab (blue diamonds) spectra for six rock types from localities
noted on the geologic map. The TIMS imagery is partially
successful at discriminating the Proterozoic gneiss from the
tonalite pluton, with differences seen both in the image and in
the spectral data. The gneiss has a distinctive red-blue
striped appearance in the northern portions of this 5-3-1 image,
where it consists of a relatively thick sequence of banded
amphibolite and quartzo-feldspathic (Q-F) gneiss. The
gabbroic and ultramafic rocks, (C) and (D), are easily
differentiated from the surrounding units but not from each
other. Thermal emission spectra for rocks found in the
White Tank Mountains. Red spectra represent spectra derived
from the six bands of the TIMS imager. Blue lines represent
spectra derived from a thermal spectrometer that have been
deconvolved to TIMS resolution.
(1) A TIMS image (5-3-1 decorrelation
stretch) and (2) corresponding geologic map showing several
important map units. To the Left are TIMS (red squares) and
lab (blue diamonds) spectra for six rock types from localities
noted on the geologic map. The TIMS imagery is partially
successful at discriminating the Proterozoic gneiss from the
tonalite pluton, with differences seen both in the image and in
the spectral data. The gneiss has a distinctive red-blue
striped appearance in the northern portions of this 5-3-1 image,
where it consists of a relatively thick sequence of banded
amphibolite and quartzo-feldspathic (Q-F) gneiss. The
gabbroic and ultramafic rocks, (C) and (D), are easily
differentiated from the surrounding units but not from each
other. Thermal emission spectra for rocks found in the
White Tank Mountains. Red spectra represent spectra derived
from the six bands of the TIMS imager. Blue lines represent
spectra derived from a thermal spectrometer that have been
deconvolved to TIMS resolution.